

UrjaLogic
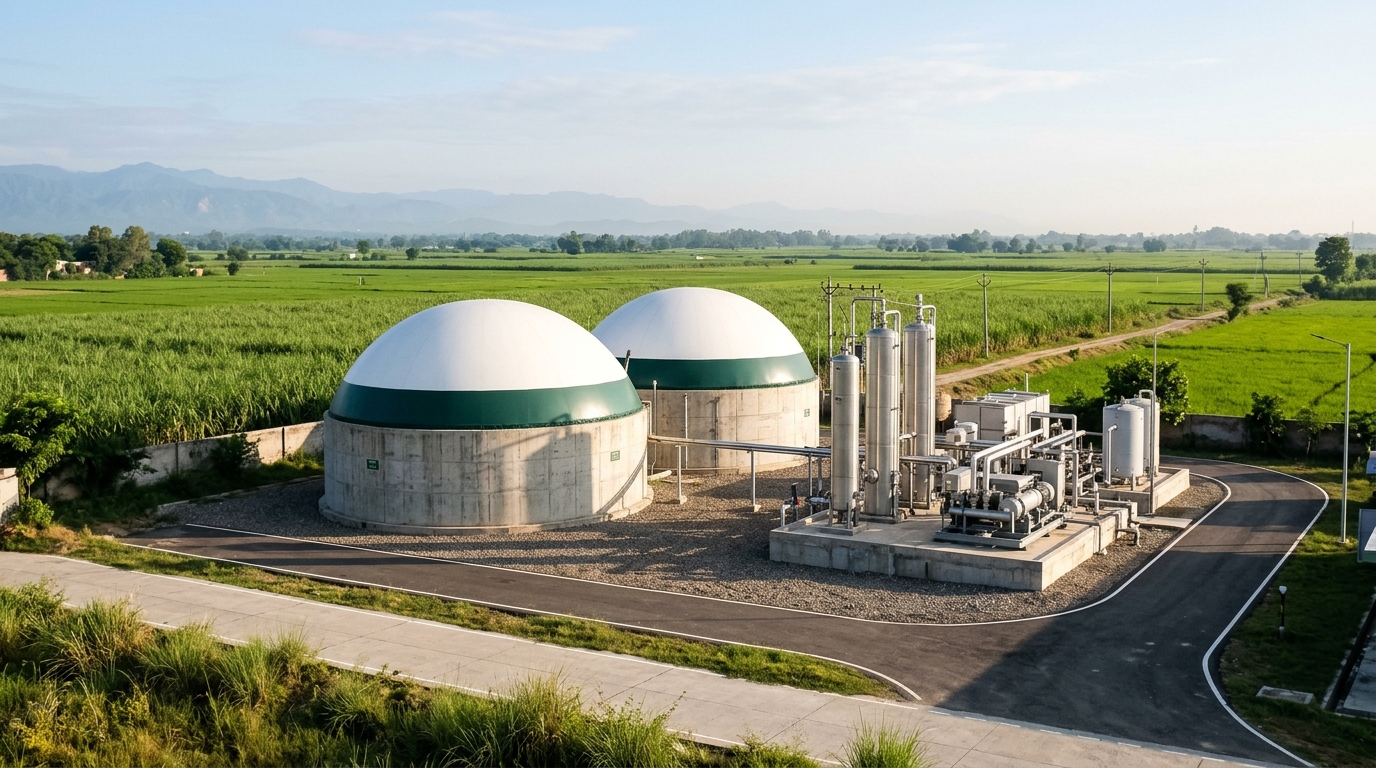
Modern North Indian Compressed Biogas plant with twin anaerobic digesters and stainless gas upgrading columns

Compressed Biogas (CBG)

Digital twinning and analytics for higher CBG yield on the equipment you already own.

Gain 24/7 visibility inside your digesters using existing SCADA logs, weighbridge slips, and lab sheets. Spot biological upsets 3 to 7 days early, feed the most profitable daily mix, and verify every rupee gained directly on your plant meters.

01

Software-First Start (Zero New Sensors)

Go live in week one using the SCADA exports, PLC tags, weighbridge slips, and periodic lab sheets your plant already collects, without buying expensive inline analyzers.

02

24/7 Co-Pilot for Your Plant Team

Backs your plant manager and chemist across all three shifts by tracking internal acid and alkalinity health continuously between manual lab tests.

03

3 to 7 Day Early Upset Warnings

Spots biological drift days early and prompts your team to hold feed or run one targeted lab check long before foaming or souring cuts gas output.

04

100% Metered & Verifiable Payback

Because every ton of biomass, cubic meter of gas, and kWh of electricity is measured on site, every rupee of recovered yield and saved power is plain to see.

CBG Efficiency Challenges

Why Indian CBG plants miss DPR output even with good equipment and diligent staff.

In Compressed Biogas, margin does not leak in one spot. Six connected challenges across biomass storage, multi-day digester biology, gas upgrading, and power draw routinely leave 15-30% of plant cashflow uncaptured.

Read our guide: Inside Anaerobic Digesters & the 8 Operating Factors →

01 Feedstock & Clamp Storage Economics
10-25% seasonal yield swing

Changing feedstock quality priced by truck weight instead of gas potential

Indian CBG plants rotate through paddy straw, press mud, Napier grass, cattle dung, and agro-waste across seasons. Moisture, ash, C:N balance, and storage loss in open clamps shift week to week, so buying and feeding purely by tonnage quietly raises true ₹/kg CBG cost and unsettles biology.

How UrjaLogic Helps Your Team

Tracks real gas potential and storage age per stockyard lot, recommending the highest-profit daily feeding mix within safe digester load limits.

02 Anaerobic Digester Biology
10-21 days lost per souring event

Multi-day biological lag means twice-weekly lab tests warn too late

Today’s feed shapes digester health days later. Even with a diligent lab team testing FOS/TAC and VFA twice a week, acid buildup or foaming often grows unseen between samples until pH drops and gas output collapses, costing ₹18-30 lakh in lost revenue per upset.

How UrjaLogic Helps Your Team

Watches existing PLC trends and periodic lab entries continuously to warn your plant head 3 to 7 days ahead of biological trouble.

03 Capacity Utilization Gap
15-30% built capacity left idle

Cautious under-feeding out of fear of crashing the digester

Because a single biological crash is so expensive, many CBG plants conservatively run digesters at 60-75% of design load. Fixed bank interest, salaries, and overheads stay at 100%, making unused capacity the biggest drag on plant cashflow.

How UrjaLogic Helps Your Team

Gives your operators clear biological safety margins and timely lab-check prompts so they can step up loading steadily toward full nameplate output.

04 Gas Scrubbing & Upgrading
2-5% CH₄ vented in tail gas

Unnoticed methane slip and unplanned flaring

In PSA, membrane, and water-scrubbing units, small valve-timing drift, media wear, or pressure swings let 2-5% methane slip into off-gas. It rarely triggers a trip alarm, yet vents ₹35-80 lakh per year of sellable gas on a mid-sized plant.

How UrjaLogic Helps Your Team

Continuously compares metered raw biogas against upgraded CBG output and flags abnormal methane slip or flaring in ₹/day immediately.

05 Auxiliary Electricity Load
0.65-1.1 kWh / kg CBG spread

Excess power burned across shredders, mixers, upgraders & compressors

Electricity (grid plus DG backup) is typically the second-largest plant expense after feedstock. Without live kWh/kg tracking per section, continuous over-mixing, cooler scaling, and compressor valve wear hide inside a single monthly power bill.

How UrjaLogic Helps Your Team

Tracks metered power per kg CBG across each section every shift, spotting compressor wear early and cutting mixer electricity waste.

06 Shift Handovers, Sensor Drift & Rural Internet
15-30 day delay on true ₹/kg cost

Drifting probes, patchy internet, and scattered shift records

Weighbridge slips, lab notebooks, SCADA screens, power meters, cascade fills, and manure sales sit in separate places. Fouled probes mislead night shifts and rural internet drops interrupt cloud dashboards, leaving owners waiting until month-end to see real unit cost.

How UrjaLogic Helps Your Team

Flags flatlined or drifting sensors automatically, keeps working offline on rural sites, and delivers daily ₹/kg cost breakdowns at 8:00 AM.

Interactive Product View

What your plant manager and promoter see every morning at 08:00 AM.

Click through the four live views below, from metered daily output and loss breakdown to the 7-day digester forecast and daily feedstock mix.

UrjaLogic Digital Twin & PlantOS · Sample 12 TPD CBG Facility · Morning Brief (08:00 IST)
24/7 Operator Co-Pilot · Read-Only

Yesterday’s Metered CBG

10.4 TPD

Nameplate: 12.0 TPD (86.7%)

Actual Production Cost

₹41.8 / kg

₹2.4 / kg better vs. 30d avg

Metered Power / kg

0.84 kWh/kg

+0.11 kWh above baseline

Recoverable Margin Gap

₹87,600 / day

3 operator actions ranked

Metered Loss Breakdown (Where 1.6 TPD Went Yesterday)

Reconciled from weighbridge, gas meters & lab logs
Expected CBG from weighed biomass fed 12.0 TPD
Digester 2 conversion dip (wet straw moisture spike) -0.9 TPD (₹50,400)
PSA Upgrader methane slip (3.2% tail gas) -0.4 TPD (₹22,400)
Compressor trip & cascade changeover wait -0.3 TPD (₹14,800)
Net Metered & Billed CBG Dispatched 10.4 TPD

Morning Guidance for Your Plant Team

  • 1 · Digester 2 Stability Hold

    Hold feeding steady for 24h and log one FOS/TAC lab check by 18:00. Prevents foaming risk in 4 days.

  • 2 · Upgrader Valve Inspection

    PSA methane slip rose from 1.6% to 3.2% since Tuesday. Check Cycle Valve B timing during scheduled stop.

  • 3 · Recommended Feedstock Blend

    Shift 10% feed from high-moisture straw lot to Clamp #14 press mud for +₹18,500/day net margin.

Sent daily at 08:00 AM on web, mobile, and WhatsApp. Your plant manager approves every change.

6-15%

higher metered gas output

Run safely closer to full nameplate capacity

Early biological warnings and daily blend guidance give your operations team the clarity to raise gas output per ton fed without risking a ₹20-30L souring crash.

2-5%

upgrader methane slip caught

Stop silent gas venting and compressor power waste

Comparing raw gas meters against cascade fills and compressor kWh catches PSA methane slip and valve wear early, protecting ₹35-80L a year in directly measurable margin.

Week 1

software-first deployment

Start right away from your existing logs and meters

No plant shutdowns, no PLC rewrites, and zero expensive sensor capex. Calibrate your plant’s digital twin on existing records and see clear before-and-after results on your meters.

Plant Owners & Promoters

Exact ₹/kg cost, metered yield, and plant health every morning

  • · Daily profit, metered gas recovery, and loss breakdown at 08:00 AM
  • · Clear before-and-after efficiency numbers verified on your own meters
  • · Pairs with tailor-made UrjaLogic ERP or connects cleanly to existing books

Plant Managers & Shift Teams

Clear daily targets and early warnings across every shift

  • · Daily feedstock mix, clamp rotation, and safe loading guidance
  • · 3 to 7 day biological warnings across all shift handovers
  • · Strictly read-only on your PLC so your team approves every action

EPCs & Multi-Plant Groups

Consistent performance across every commissioned site

  • · Compare kg/ton yield and kWh/kg power across 5 to 50+ plants
  • · Spot biological drift or faulty probes remotely before sending engineers
  • · Standardize best operating practices across site teams

Owner & Operator FAQ

Practical answers on operator teams, measurable ROI, and plant safety.

We already have a full operations team and SCADA panel. Why add a digital twin?

SCADA panels show current equipment readings and site teams manage daily runs, but neither can track hidden acid buildup continuously between twice-weekly lab tests or recalculate multi-feedstock economics every morning across all three shifts. UrjaLogic adds continuous analytical visibility while your team stays in full control.

How easily can we verify whether UrjaLogic is actually delivering value?

Very easily, because a CBG plant weighs and meters everything. You see the exact impact on four existing numbers: kg of billed CBG per ton of feedstock weighed at the gate, raw gas vs. upgraded CBG recovery, kWh of electricity per kg produced, and uninterrupted full-load operating days.

Do we need to install expensive new inline sensors on our digesters?

No. UrjaLogic starts directly with the data your plant already generates: existing PLC/SCADA logs, flowmeters, gas analyzers, weighbridge slips, and manual lab sheets. If you add more sensors later, they plug right in.

How does this connect with plant ERP and commercial billing?

You can run UrjaLogic’s digital twin standalone alongside your existing accounting setup, or pair it natively with our tailor-made UrjaLogic ERP built specifically for CBG plants and plant operators (covering biomass buying, weighbridge, cascades, OMC billing, FOM sales, and GST).

Closed Beta

We are onboarding select Indian CBG facilities by invite.

Start with a confidential 30-day baseline review on your existing plant logs with Goljyu Innovations Private Limited.

Request an Invite →